Question #6448128Fill in the Blank
Algebra-2
Question
A mapping diagram shows the relation between the input values and the output values.
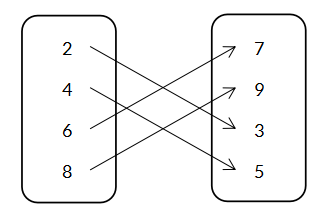
The range of this relation is {_________}.
A mapping diagram shows the relation between the input values and the output values.
The range of this relation is {_________}.