Question #6447583Fill in the Blank
Algebra-1
Question
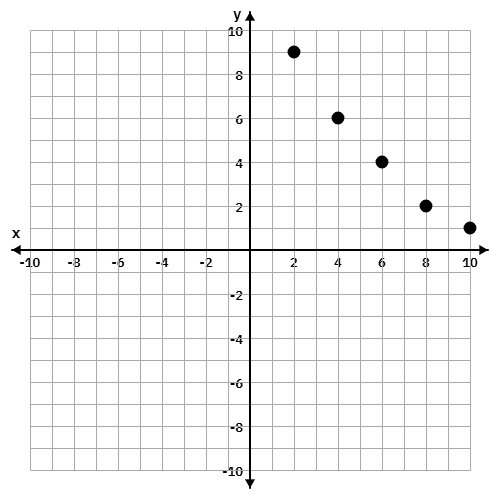
A scatter plot displays the relationship between the number of hours spent on social media and the amount of sleep a group of students get. The overall trend of the points is from the top-left to the bottom-right, indicating a _________ correlation between the two variables.