Question Analysis
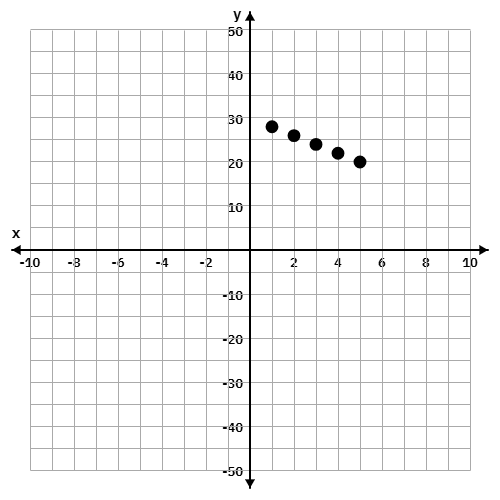
This question tests the student's ability to recognize and identify negative correlation in a scatter plot. The data points show a clear trend where as one variable (hours spent exercising) increases, the other variable (BMI) decreases.
Key Concept Explanation
Negative correlation occurs when an increase in one variable is associated with a decrease in the other variable. In a scatter plot, this is represented by data points that trend from the top-left to the bottom-right.
Step-by-step Solution
1. Identify the given data points: (1, 28), (2, 26), (3, 24), (4, 22), (5,...
Click "Show Answer" to reveal the answer and analysis