Question Analysis
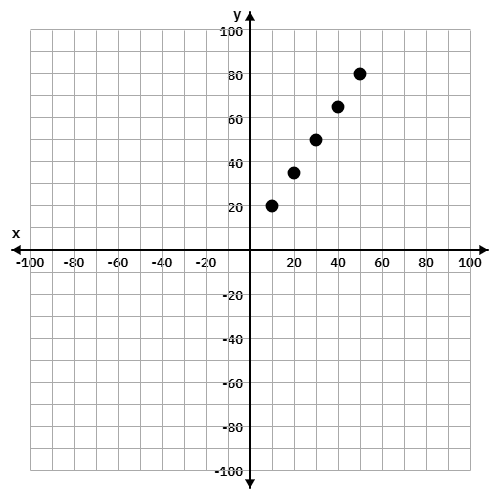
This question assesses the student's ability to recognize and identify positive correlation in a scatter plot. The data points show a clear trend where as one variable (number of pages read) increases, the other variable (time spent reading) also increases.
Key Concept Explanation
Positive correlation occurs when an increase in one variable is associated with an increase in the other variable. In a scatter plot, this is represented by data points that trend from the bottom-left to the top-right.
Step-by-step Solution
1. Identify the given data points: (10, 20), (20, 35), (30, 50), (40, ...
Click "Show Answer" to reveal the answer and analysis