Question #6447233Fill in the Blank
Algebra-1
Question
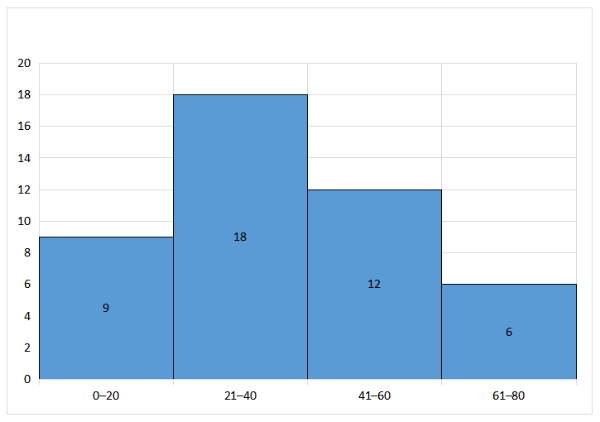
The histogram below shows the number of emails received per day by employees:
Answer & Analysis
Want More Practice Questions?
Access thousands of practice questions with detailed explanations on Scholardog.
Practice Now - It's Free!