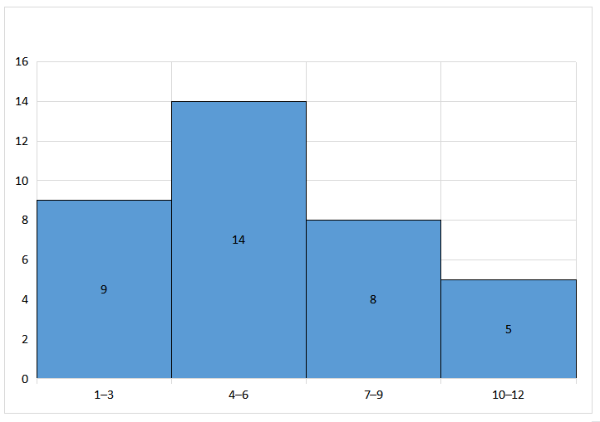
The histogram below shows the number of hours students spent studying for a test:
The percentage of students who studied 6 or fewer hours (rounded to the nearest whole number) is _______%.
Answer & Analysis
Analysis
Question Analysis
This question involves calculating the percentage of students whose study hours fall within a specific range (6 or fewer hours) using a histogram.
The main focus is on finding the total number of students, the number in the target range, and converting this to a percentage.
Key Concept Explanation
Percentage from Frequencies: To find the percentage of data points in a range, use the formula:
Want More Practice Questions?
Access thousands of practice questions with detailed explanations on Scholardog.