Question #6447218Fill in the Blank
Algebra-1
Question
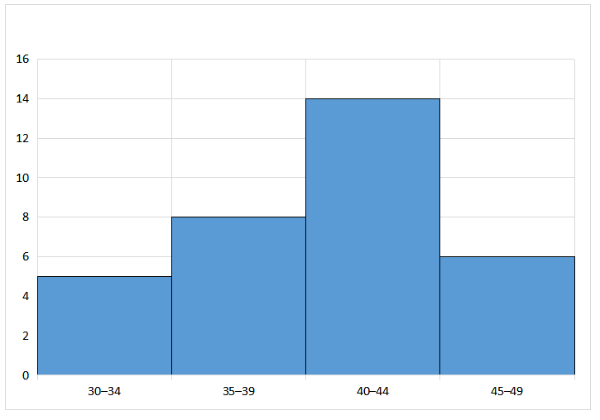
The histogram below shows the number of hours employees worked in a week.
Answer & Analysis
Click "Show Answer" to reveal the answer and analysis
Want More Practice Questions?
Access thousands of practice questions with detailed explanations on Scholardog.
Practice Now - It's Free!