Question Analysis
This question involves calculating the range of a dataset represented by a line plot.
The main focus is on determining the spread of the data using the maximum and minimum values from the line plot.
Key Concept Explanation
Range: Represents how much the data varies, calculated by subtracting the smallest value from the largest value in the dataset.
Line Plot Clues: In a line plot, the minimum value is the leftmost mark, and the maximum is the rightmost mark, simplifying their identification.
Step-by-step Solution
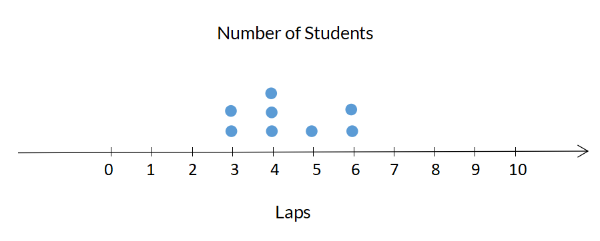
Find the minimum value: The smallest number of laps is 3 (leftmost mark in the line plot).
Find the maximum value: The large...