Question Analysis
This question involves analyzing a dot plot (or a dataset represented by a dot plot) to identify the mode, which is the value with the highest frequency.
The main focus is on understanding frequency in the context of dot plots and recognizing the most frequently occurring data point.
Key Concept Explanation
Frequency: The number of times a specific value appears in a dataset. In a dot plot, frequency is represented by the number of dots stacked above a value on the number line.
Mode: The value with the highest frequency in a dataset, which is visually identifiable as the value with the tallest stack of dots in a dot plot.
Step-by-step Solution
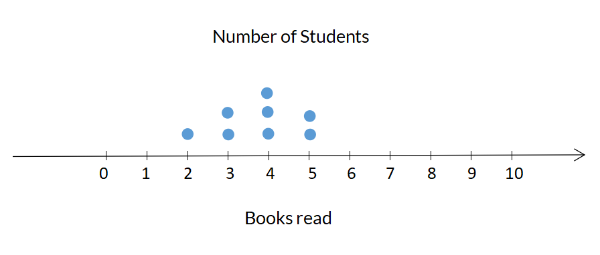
Calculate the frequency of each value:
2 appears 1 time.
3...