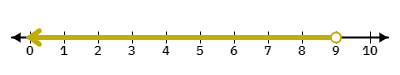
Refer to the graph below. The inequality represented by the shaded region on the number line is .
Answer & Analysis
Analysis
Question Analysis
This question tests the student's ability to interpret a graphical representation of an inequality and write it in symbolic form.
Key Concept Explanation
Inequalities can be represented on a number line, where the shaded region indicates the solution set. An open circle on the number line indicates that the endpoint is not included in the solution set.
Step-by-step Solution
1. Observe the number line and identify the shaded region.
2. Determine the direction of the shading (to the left or right of the point).
3. Identify the type of circle (open or closed) at the endpoint.
4. Write the inequality based on the observations:
Want More Practice Questions?
Access thousands of practice questions with detailed explanations on Scholardog.