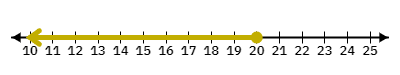
Refer to the graph below. The shaded region represents the solution set for the inequality .
Answer & Analysis
Analysis
Question Analysis
This question tests the student's ability to interpret a number line and identify the correct inequality symbol based on the shaded region.
Key Concept Explanation
Inequalities are used to compare two expressions, and the number line is a visual representation of the solution set.
Step-by-step Solution
1. Observe the number line and note that the shaded region is to the left of 20.
2. A closed circle at 20 indicates that 20 is included in the solution set.
3. Therefore, the inequality is
Want More Practice Questions?
Access thousands of practice questions with detailed explanations on Scholardog.