Question #6444980Fill in the Blank
Algebra-1
Question
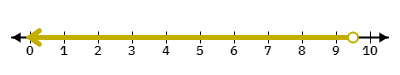
Refer to the graph below. The inequality represented by the shaded region on the number line is .
Answer & Analysis
Analysis
Question Analysis
This question tests the student's ability to interpret a number line and identify the correct inequality symbol that represents the shaded region.
This question tests the student's ability to interpret a number line and identify the correct inequality symbol that represents the shaded region.
Key Concept Explanation
Inequalities use symbols such as , , , and to compare two expressions. A number line is a visual representation where each point corresponds to a number, and the shaded region indicates the solution set.
Inequalities use symbols such as , , , and to compare two expressions. A number line is a visual representation where each point corresponds to a number, and the shaded region indicates the solution set.
Step-by-step Solution
1. Observe the number line and identify the boundary point (9.5 in this case).
2. Determine if the boundary point is included or excluded. An open circle indicates exclusion, while a closed circle indicates inclusion.
3. Identify the direction of the shading. If the shading is to the left, the inequality is less than (
Want More Practice Questions?
Access thousands of practice questions with detailed explanations on Scholardog.
Practice Now - It's Free!