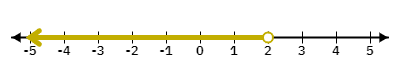
Refer to the graph below. The inequality represented by the shaded region on the number line is .
Answer & Analysis
Analysis
Question Analysis
This question tests the student's ability to interpret a number line and identify the correct inequality symbol that represents the shaded region.
Key Concept Explanation
Inequalities use symbols such as to compare two expressions. A number line is a visual representation where each point corresponds to a number. The shaded region on the number line indicates the solution set of the inequality.
Step-by-step Solution
1. Observe the number line and note the position of the open circle at 2.
2. Determine that the open circle indicates that 2 is not included in the solution set.
3. Identify that the shaded region is to the left of 2, indicating all numbers less than 2 are part of the solution set.
4. Conclude that the inequality is
Click "Show Answer" to reveal the answer and analysis
Want More Practice Questions?
Access thousands of practice questions with detailed explanations on Scholardog.