Question #6444976Fill in the Blank
Algebra-1
Question
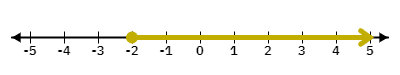
Refer to the graph below. The inequality represented by the shaded region on the number line is .
Answer & Analysis
Analysis
Question Analysis
This question tests the student's ability to interpret a graphical representation of an inequality and write it in symbolic form.
This question tests the student's ability to interpret a graphical representation of an inequality and write it in symbolic form.
Key Concept Explanation
Inequalities are mathematical statements that use symbols such as , , , and to compare two expressions. The number line is a visual representation where each point corresponds to a number, and the shaded region indicates the solution set.
Inequalities are mathematical statements that use symbols such as , , , and to compare two expressions. The number line is a visual representation where each point corresponds to a number, and the shaded region indicates the solution set.
Step-by-step Solution
1. Observe the number line and identify the boundary point, which is -2.
2. Determine if the boundary point is included or excluded. A closed circle at -2 indicates that -2 is included.
3. Identify the direction of the shading. Shading to the right of -2 indicates all numbers greater than or equal to -2.
4. Write the inequality:
Want More Practice Questions?
Access thousands of practice questions with detailed explanations on Scholardog.
Practice Now - It's Free!