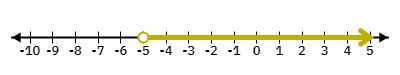
Refer to the graph below. The inequality represented by the shaded region on the number line is ___________.
Answer & Analysis
Analysis
Question Analysis
This question tests the student's ability to interpret a number line and write the corresponding inequality. The open circle at -5 and the shading to the right indicate that all values greater than -5 are part of the solution set.
Key Concept Explanation
Inequalities use symbols like <, >, ≤, and ≥ to compare two expressions. A number line is a visual representation where each point corresponds to a number. The solution set is the set of all values that satisfy the inequality.
Step-by-step Solution
1. Identify the point on the number line where the shading starts (-5 in this case).
2. Determine the direction of the shading (to the right, indicating values greater than -5).
3. Write the inequality using the appropriate symbol:
Want More Practice Questions?
Access thousands of practice questions with detailed explanations on Scholardog.