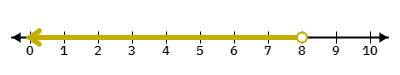
Refer to the graph below. The inequality represented by the shaded region on the number line is __________.
Answer & Analysis
Analysis
Question Analysis
This question tests the student's ability to interpret a number line and write the corresponding inequality. The open circle at 8 and the shading to the left indicate that all values less than 8 are part of the solution set.
Key Concept Explanation
Inequalities use symbols like , , , and to compare two expressions. A number line is a visual representation where each point corresponds to a number. The solution set is the set of all values that satisfy the inequality.
Step-by-step Solution
1. Identify the point on the number line where the shading starts (8 in this case).
2. Determine the direction of the shading (to the left, indicating values less than 8).
3. Write the inequality using the appropriate symbol:
Click "Show Answer" to reveal the answer and analysis
Want More Practice Questions?
Access thousands of practice questions with detailed explanations on Scholardog.