Question #6444968Fill in the Blank
Algebra-1
Question
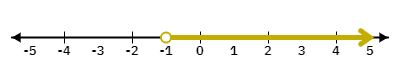
Refer to the graph below. The inequality represented by the shaded region is _________.
Answer & Analysis
Analysis
Question Analysis
This question tests the student's ability to recognize and interpret inequalities on a number line. The shaded region to the right of -3 with an open circle at -3 indicates that all values greater than -3 are part of the solution set.
This question tests the student's ability to recognize and interpret inequalities on a number line. The shaded region to the right of -3 with an open circle at -3 indicates that all values greater than -3 are part of the solution set.
Key Concept Explanation
Inequalities use symbols such as , , , and to compare two expressions. On a number line, an open circle indicates that the point is not included in the solution set, while a shaded region to the right of the point indicates the range of values that satisfy the inequality.
Inequalities use symbols such as , , , and to compare two expressions. On a number line, an open circle indicates that the point is not included in the solution set, while a shaded region to the right of the point indicates the range of values that satisfy the inequality.
Step-by-step Solution
1. Identify the position of the open circle on the number line (at -1).
2. Determine the direction of the shading (to the right of -1).
3. Conclude that the inequality is
1. Identify the position of the open circle on the number line (at -1).
2. Determine the direction of the shading (to the right of -1).
3. Conclude that the inequality is
Want More Practice Questions?
Access thousands of practice questions with detailed explanations on Scholardog.
Practice Now - It's Free!