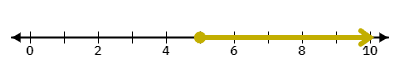
Refer to the graph below. The shaded region represents the solution set for the inequality .
Answer & Analysis
Analysis
Question Analysis
This question tests the student's ability to recognize and write an inequality based on a given number line graph.
Key Concept Explanation
Inequalities are mathematical statements that use symbols such as to compare two expressions. The number line is a visual representation of numbers where each point on the line corresponds to a number.
Step-by-step Solution
1. Observe the graph and identify the shaded region.
2. Determine the boundary point, which is 5 in this case.
3. Note that the boundary point is included in the solution set, indicated by a closed circle.
4. Write the inequality:
Want More Practice Questions?
Access thousands of practice questions with detailed explanations on Scholardog.