Question #6444674Fill in the Blank
Algebra-1
Question
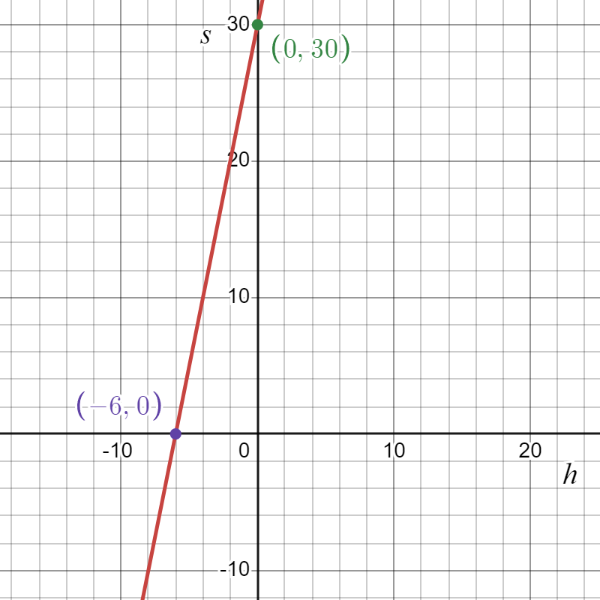
Refer to the graph below. The graph shows the relationship between the number of hours a student studies and the score they receive on a test. Write an equation that represents the line shown in the graph, where is the number of hours studied and is the score received. The equation should be in the form , where is the slope and is the y-intercept. The equation is ___________.