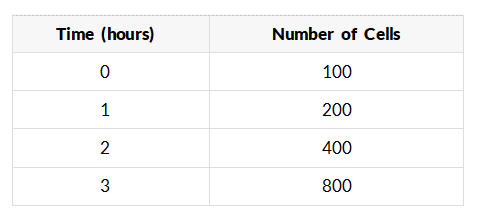
Consider the following table showing the number of cells in a culture over time. The relationship between the number of cells and time is _________.
Answer & Analysis
Analysis
Question Analysis
This question evaluates the student's ability to identify an exponential relationship from a data table by recognizing the pattern of a constant relative rate of change.
Key Concept Explanation
In an exponential relationship, the dependent variable (number of cells) changes by a constant ratio for each unit increase in the independent variable (time). Here, the number of cells doubles every hour.
Step-by-step Solution
1. Examine the table and observe the number of cells at each time point.
2. Calculate the ratio between consecutive values: ,
Want More Practice Questions?
Access thousands of practice questions with detailed explanations on Scholardog.