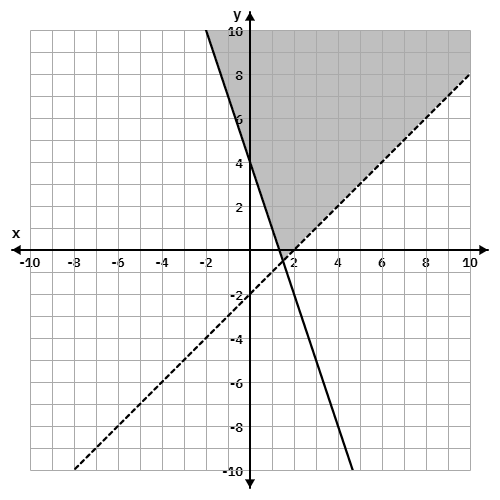
The graph below represents the solution set for a system of linear inequalities. Write the system of inequalities that corresponds to the shaded region.
Answer & Analysis
Analysis
Question Analysis
This question evaluates the student's ability to match the correct inequality symbols to the boundary lines and the shaded region in a graph.
Key Concept Explanation
The key concept is to understand the graphical representation of linear inequalities and how to interpret the boundary lines and the shaded region.
Step-by-step Solution
1. Identify the boundary lines: and .
2. Determine the type of line for each boundary:
The line is dashed and the shaded region is above the line, so the inequality is .
3. The line
Want More Practice Questions?
Access thousands of practice questions with detailed explanations on Scholardog.