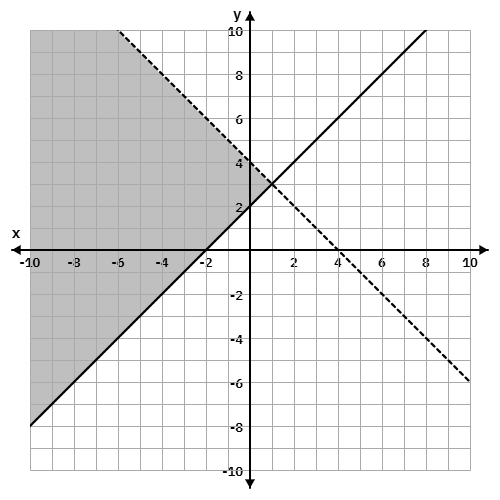
Refer to the graph below. The system of linear inequalities is represented by the shaded region. Write the system of inequalities that corresponds to the shaded area.
Answer & Analysis
Analysis
Question Analysis
This question tests the student's ability to identify and write the system of linear inequalities based on a given graph. The shaded region represents the solution set, and the boundary lines are provided.
Key Concept Explanation
The key concept here is understanding how to determine the inequality symbols based on the boundary lines and the shaded region. Solid lines indicate "≤" or "≥", while dashed lines indicate "<" or ">".
Step-by-step Solution
1. Identify the boundary lines: and .
2. Determine the type of line for each boundary:
The line is solid and the shaded region is above the line, so the inequality is
Click "Show Answer" to reveal the answer and analysis
Want More Practice Questions?
Access thousands of practice questions with detailed explanations on Scholardog.