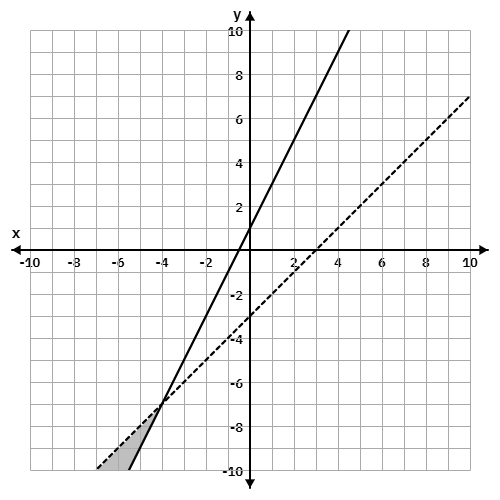
Refer to the graph below. The system of linear inequalities is represented by the shaded region. Write the system of inequalities that corresponds to the shaded area. Use the form:
Answer & Analysis
Analysis
Question Analysis
This question tests the student's ability to interpret a graph and write the corresponding system of linear inequalities. The shaded region indicates the solution set, and the student must determine the correct inequality symbols based on the boundary lines.
Key Concept Explanation
The key concept here is understanding how the boundary lines and shading in a graph represent the solution set of a system of linear inequalities.
Step-by-step Solution
1. Identify the boundary lines from the graph: and .
2. Determine the type of line for each boundary:
is a solid line and the shaded region is above the line, indicating .
is a dashed line and the shaded region is below the line, indicating
Want More Practice Questions?
Access thousands of practice questions with detailed explanations on Scholardog.