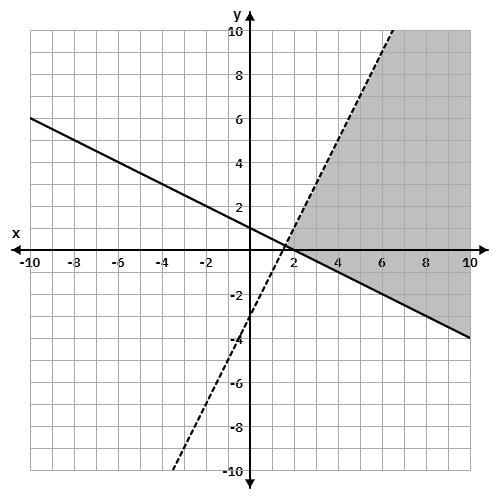
Refer to the graph below. The shaded region represents the solution to a system of linear inequalities. Write the system of inequalities that corresponds to the shaded region. (Use x and y as variables.)
Answer & Analysis
Analysis
Question Analysis
This question tests the student's ability to identify the system of linear inequalities from a given graph. The shaded region indicates the overlapping area where all inequalities are satisfied.
Key Concept Explanation
The key concept here is understanding how to interpret the boundary lines and shading on a graph to write the corresponding system of linear inequalities.
Step-by-step Solution
1. Identify the boundary lines in the graph. One line is solid, and the other is dashed.
2. Determine the equations of these lines.
For the solid line, it passes through points (0, 1) and (2, 0), so the equation is .
For the dashed line, it passes through points (0, -3) and (2, 1), so the equation is
Want More Practice Questions?
Access thousands of practice questions with detailed explanations on Scholardog.