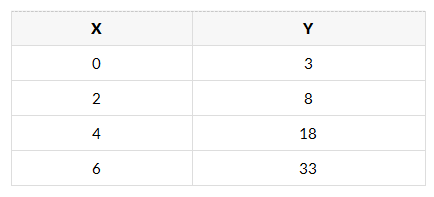
The table below shows x and y values for a function. This function represents a ___________ relationship.
Answer & Analysis
Analysis
Question Analysis
This question involves assessing the nature of a relationship between two variables using a table of values. The main focus is on determining whether the relationship is linear or non - linear by examining the consistency of changes in y (i.e., ) when x increases by a constant amount (2 units here).
Key Concept Explanation
A linear relationship is defined by a constant rate of change: when x increases by a fixed interval, y must increase or decrease by a constant value. This is because linear functions follow the form , where m (the slope) is constant, so (for a fixed , remains the same).
A non - linear relationship lacks this constant rate of change. When x increases by a fixed interval, the changes in y (
Want More Practice Questions?
Access thousands of practice questions with detailed explanations on Scholardog.