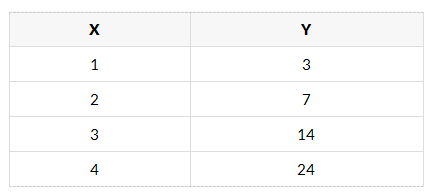
The table below shows the values of x and y for a function. This function represents a ___________ relationship.
Answer & Analysis
Analysis
Question Analysis
This question involves analyzing a function represented by a table of values. The main focus is on determining the linearity of the function by examining the consistency of changes in y as x increases by a constant amount (1 unit here).
Key Concept Explanation
For a linear function, when x increases by a constant interval (like 1), the corresponding change in y (denoted as ) should be constant. This constant change in y is related to the slope of the linear function. In contrast, for a non - linear function, these changes in y are not constant.
Step-by-step Solution
1. Calculate the changes in y for each increase in x by 1.
From to :
From to
Want More Practice Questions?
Access thousands of practice questions with detailed explanations on Scholardog.