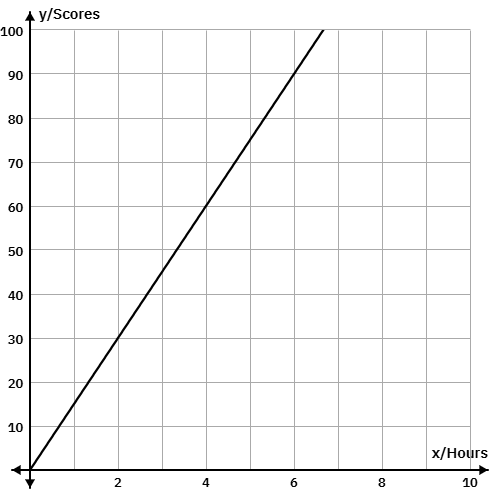
Question Analysis
This question requires students to interpret a graph and extract specific information from it. The graph shows a linear relationship between the number of hours spent studying and the test score. Students need to find the test score corresponding to 4 hours of study.
Key Concept Explanation
The key concept here is understanding how to read and interpret data from a graph. Students should be able to locate the given value on the x-axis (hours studied) and find the corresponding value on the y-axis (test score).
Step-by-step Solution
1. Identify the x-axis value: 4 hours.
2. Locate the point on the graph where the x-value is ...
Click "Show Answer" to reveal the answer and analysis