Question Analysis
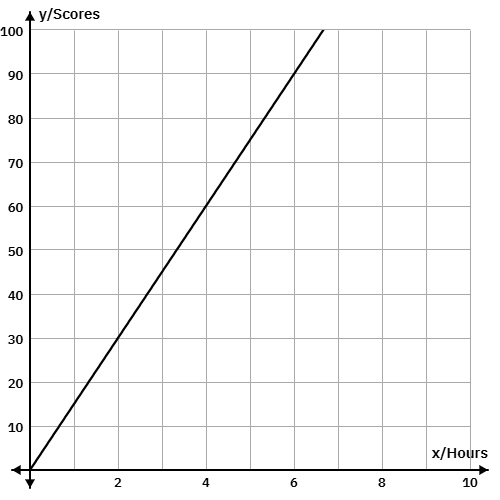
This question tests the student's ability to interpret a graph and extract information from it. The graph shows a linear relationship between the number of hours studied and the test score.
Key Concept Explanation
The key concept here is understanding how to read and interpret a graph. The x-axis represents the number of hours studied, and the y-axis represents the test score. By locating the point on the graph where the number of hours studied is 5, we can determine the corresponding test score.
Step-by-step Solution
Click "Show Answer" to reveal the answer and analysis
Want More Practice Questions?
Access thousands of practice questions with detailed explanations on Scholardog.
Practice Now - It's Free!