Question #6443377Fill in the Blank
Algebra-1
Question
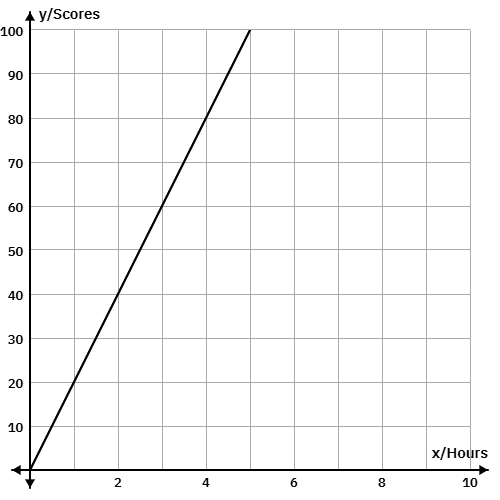
Refer to the graph below, which shows the relationship between the number of hours spent studying and the score on a test. If a student studies for 4 hours, their test score is ____.
Refer to the graph below, which shows the relationship between the number of hours spent studying and the score on a test. If a student studies for 4 hours, their test score is ____.