Question #6443372Fill in the Blank
Algebra-1
Question
A car travels at different speeds and the corresponding braking distances are recorded in the table below. What is the braking distance when the speed is 80 km/h? _______.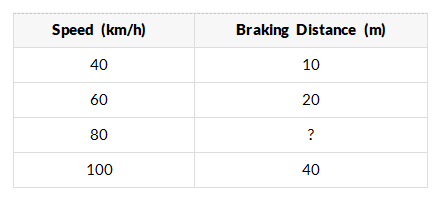
A car travels at different speeds and the corresponding braking distances are recorded in the table below. What is the braking distance when the speed is 80 km/h? _______.