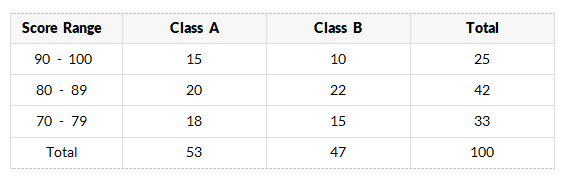
The following frequency table shows the test scores of students in two different classes:
What is the probability that a student is from Class B given that the student's score is in the 90 - 100 range?
Options
A
B
C
D
Answer & Analysis
Answer
C
Analysis
Question Analysis
This question combines conditional probability and frequency table analysis, focusing on student test scores and class affiliations.
The main emphasis is on extracting the appropriate data from the frequency table to calculate the conditional probability of a student belonging to a specific class given their score range.
Key Concept Explanation
Using the conditional probability formula , where is the event of a student being from Class B, and is the event of a student having a score in the 90 - 100 range.
In frequency table terms, this translates to:
Want More Practice Questions?
Access thousands of practice questions with detailed explanations on Scholardog.