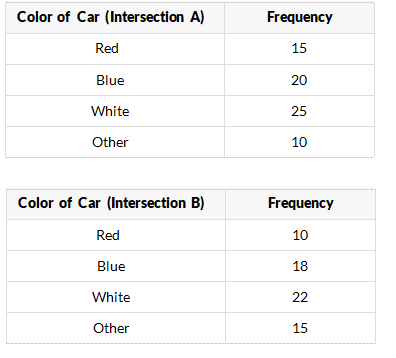
Two frequency tables show the number of cars passing through two different intersections during peak hours.
If a car passing through either intersection is randomly selected, what is the probability that it is white?
Options
A
B
C
D
Answer & Analysis
Answer
C
Analysis
Question Analysis
This question involves combining data from two frequency tables and calculating the probability of a specific event.
The main focus is on correctly adding up the frequencies of the desired category (white cars) from both tables and also finding the total combined frequency of all cars at both intersections to calculate the probability.
Key Concept Explanation
Probability of an event is calculated as the ratio of the frequency of the event to the total frequency.
When combining data from multiple sources, we sum up the relevant frequencies and the total frequencies across all the sources.
Step-by-Step Solution
First, find the total number of cars at Intersection A: .
Then, find the total number of cars at Intersection B: .
The combined total number of cars is
Want More Practice Questions?
Access thousands of practice questions with detailed explanations on Scholardog.