Question #6439915Single Choice
Geometry
Question
A frequency table records the number of defective and non - defective products in a factory production run.
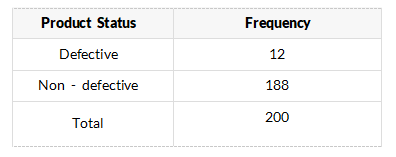
What is the relative frequency of defective products?
Options
A
0.06
B
0.12
C
0.88
D
0.94