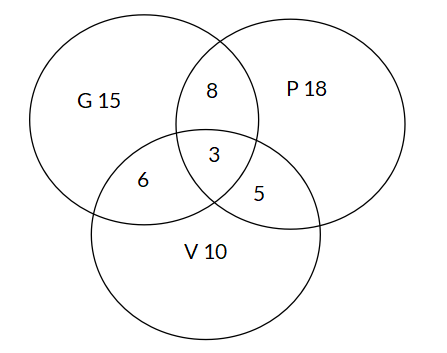
The Venn Diagram below shows the musical instrument preferences of children in a music class: guitar (G), piano (P), and violin (V). What is the probability that a randomly selected child in the class plays only the piano?
Options
A
B
C
D
Answer & Analysis
Answer
B
Analysis
Question Analysis
This question involves analyzing a Venn Diagram to calculate the probability of a single event.
The main focus is on identifying the region in the Venn Diagram that represents children who play only the piano and then calculating the probability based on the number of children in that region and the total number of children in the music class.
Key Concept Explanation
The probability of a single event is calculated as the number of outcomes for that specific event divided by the total number of possible outcomes.
In the Venn Diagram, the “only P” region represents the favorable outcomes for this event.
The total number of outcomes is obtained by summing up all the numbers in the Venn Diagram.
Step - by - Step Solution
Identify the number of favorable outcomes: The “only P” region has 18 children, indicating that these 18 children play only the piano.
Calculate the total number of children: Add up all the numbers in the Venn Diagram:
Want More Practice Questions?
Access thousands of practice questions with detailed explanations on Scholardog.