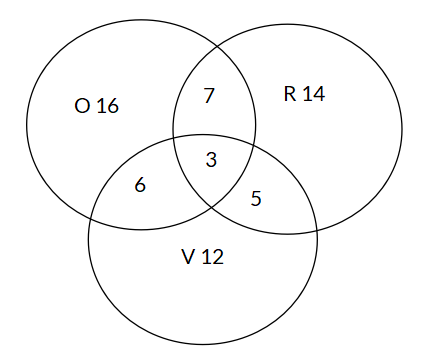
The Venn Diagram below shows the activities of students during summer vacation: taking online courses (O), reading books (R), and volunteering (V). What is the probability that a randomly selected student takes online courses, reads books, and volunteers during summer vacation?
Options
A
B
C
D
Answer & Analysis
Answer
A
Analysis
Question Analysis
This question involves analyzing a Venn Diagram to calculate the probability of a compound event where three specific activities occur simultaneously.
The main focus is on accurately identifying the intersection region of all three sets in the Venn Diagram and determining the probability based on the number of students in that region compared to the total number of students.
Key Concept Explanation
The probability of multiple events happening together is found by dividing the number of outcomes where all events take place by the total number of possible outcomes.
In the Venn Diagram, the area where the sets for taking online courses (O), reading books (R), and volunteering (V) all overlap represents the favorable outcomes for this event.
The sum of all the numbers in the Venn Diagram gives the total number of outcomes.
Step - by - Step Solution
Identify the number of favorable outcomes: The region where O, R, and V overlap has 3 students, meaning these 3 students engage in all three activities during summer vacation.
Calculate the total number of students: Add up all the numbers in the Venn Diagram:
Want More Practice Questions?
Access thousands of practice questions with detailed explanations on Scholardog.