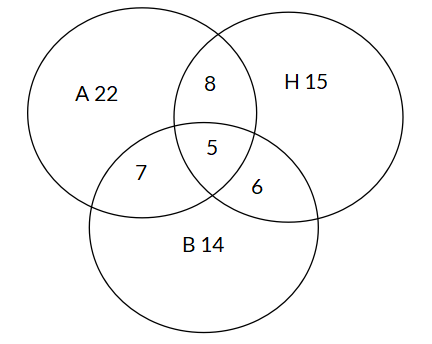
The Venn Diagram below shows the vacation preferences of a group of people: traveling abroad (A), visiting historical sites (H), and going to the beach (B). What is the probability that a randomly selected person wants to travel abroad, visit historical sites, and go to the beach?
Options
A
B
C
D
Answer & Analysis
Answer
B
Analysis
Question Analysis
This question involves analyzing a Venn Diagram to calculate the probability of a compound event where three conditions are met simultaneously.
The main focus is on identifying the region in the Venn Diagram that represents the intersection of all three sets and then calculating the probability based on the number of elements in that region and the total number of elements.
Key Concept Explanation
The probability of multiple events occurring together is calculated as the number of outcomes where all events happen divided by the total number of possible outcomes.
In the context of the Venn Diagram, the region where all three sets (A, H, and B) overlap represents the favorable outcomes for this event.
The total number of outcomes is the sum of all the numbers in the Venn Diagram.
Step - by - Step Solution
Identify the number of favorable outcomes: The region where A, H, and B overlap has 5 people, which are the ones who want to travel abroad, visit historical sites, and go to the beach.
Calculate the total number of people: Add up all the numbers in the Venn Diagram:
Want More Practice Questions?
Access thousands of practice questions with detailed explanations on Scholardog.