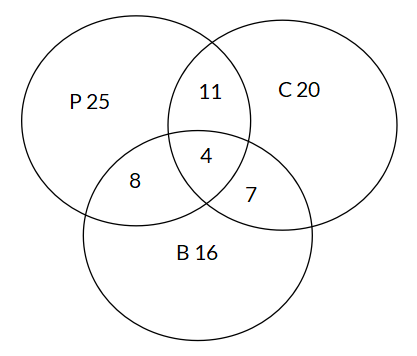
The Venn Diagram below shows the number of students in a high school who are taking different courses: physics (P), chemistry (C), and biology (B). What is the probability that a randomly selected student is taking physics and chemistry but not biology?
Options
A
B
C
D
Answer & Analysis
Answer
D
Analysis
Question Analysis
This question involves analyzing a Venn Diagram to calculate the probability of a compound event with specific conditions.
The main focus is on correctly identifying and summing up the relevant regions in the Venn Diagram that represent students taking physics and chemistry but not biology, and then determining the probability.
Key Concept Explanation
The probability of an event is calculated as the number of favorable outcomes divided by the total number of outcomes.
In the context of the Venn Diagram, the “P and C only” region represents the favorable outcomes for this event.
The total number of outcomes is the sum of all the numbers in the Venn Diagram, representing the total number of students taking these courses.
Step - by - Step Solution
Identify the number of favorable outcomes: The “P and C only” region has 11 students, which are the ones taking physics and chemistry but not biology.
Calculate the total number of students: Add up all the numbers in the Venn Diagram:
Click "Show Answer" to reveal the answer and analysis
Want More Practice Questions?
Access thousands of practice questions with detailed explanations on Scholardog.