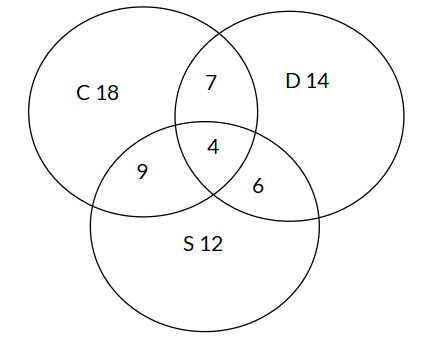
The Venn Diagram below shows the number of students in a school who are members of different clubs: chess club (C), drama club (D), and science club (S). What is the probability that a randomly selected student is a member of the chess club and the science club but not the drama club?
Options
A
B
C
D
Answer & Analysis
Answer
C
Analysis
Question Analysis
This question involves analyzing a Venn Diagram to determine the probability of a specific compound event.
The main focus is on accurately identifying the relevant region in the Venn Diagram that represents students who are members of the chess club and the science club but not the drama club, and then calculating the probability based on the number of students in that region and the total number of students.
Key Concept Explanation
The probability of an event is calculated as the number of favorable outcomes divided by the total number of outcomes.
In the context of the Venn Diagram, the “C and S only” region represents the favorable outcomes for this event.
The total number of outcomes is obtained by summing up all the numbers in the Venn Diagram, which represents the total number of students involved in these clubs.
Step - by - Step Solution
Identify the number of favorable outcomes: The “C and S only” region has 9 students, which are the students who meet the criteria of being in the chess club and the science club but not the drama club.
Calculate the total number of students: Add up all the numbers in the Venn Diagram:
Click "Show Answer" to reveal the answer and analysis
Want More Practice Questions?
Access thousands of practice questions with detailed explanations on Scholardog.