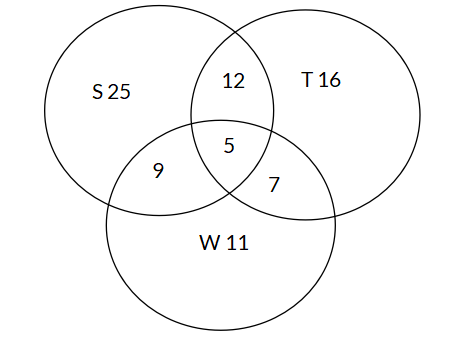
The Venn Diagram below shows the number of people who own different types of smart devices: smartphones (S), tablets (T), and smartwatches (W). What is the probability that a randomly selected person owns a smartphone and a smartwatch but not a tablet?
Options
A
B
C
D
Answer & Analysis
Answer
B
Analysis
Question Analysis
This question requires analyzing a Venn Diagram to calculate the probability of a specific compound event.
The main focus is on correctly identifying the region in the Venn Diagram that represents people who own a smartphone and a smartwatch but not a tablet, and then computing the probability based on the number of people in that region and the total number of people in the sample (represented by the sum of all regions in the Venn Diagram).
Key Concept Explanation
The probability of an event is determined by the ratio of the number of favorable outcomes to the total number of outcomes.
In this case, the favorable outcomes are the people in the “S and W only” region, and the total number of outcomes is found by adding up all the values in the Venn Diagram.
Step - by - Step Solution
Identify the number of favorable outcomes: The “S and W only” region has 9 people, which are the individuals who own a smartphone and a smartwatch but not a tablet.
Calculate the total number of people: Add up all the numbers in the Venn Diagram:
Want More Practice Questions?
Access thousands of practice questions with detailed explanations on Scholardog.