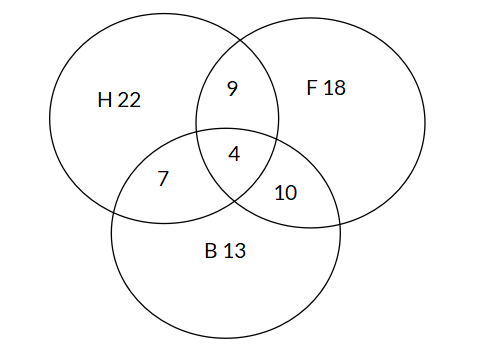
The Venn Diagram below shows the number of books in a library that have different characteristics: hardcover (H), fiction (F), and best - seller (B). What is the probability that a randomly chosen book is a fiction best - seller but not hardcover?
Options
A
B
C
D
Answer & Analysis
Answer
C
Analysis
Question Analysis
This question involves analyzing a Venn Diagram to calculate the probability of a specific compound event.
The main focus is on correctly identifying the region in the Venn Diagram that represents books which are fiction best - sellers but not hardcover, and then determining the probability based on the number of books in that region and the total number of books in the library (represented by the sum of all regions in the Venn Diagram).
Key Concept Explanation
The probability formula, where the probability of an event is the number of favorable outcomes divided by the total number of outcomes, is applied here.
The favorable outcomes are the books in the “F and B only” region, and the total number of outcomes is the sum of all the numbers in the Venn Diagram.
Step - by - Step Solution
Identify the number of favorable outcomes: The “F and B only” region has 10 books, which are the fiction best - sellers that are not hardcover.
Calculate the total number of books: Add up all the numbers in the Venn Diagram:
Click "Show Answer" to reveal the answer and analysis
Want More Practice Questions?
Access thousands of practice questions with detailed explanations on Scholardog.