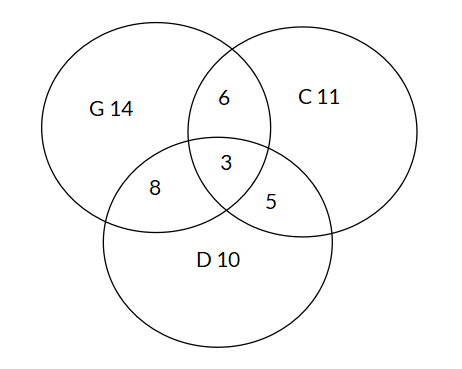
The Venn Diagram below shows the number of students in a school who are involved in different musical activities: playing the guitar (G), singing in a choir (C), and playing the drums (D). What is the probability that a randomly selected student plays the guitar and the drums but does not sing in the choir?
Options
A
B
C
D
Answer & Analysis
Answer
D
Analysis
Question Analysis
This question requires analyzing a Venn Diagram to determine the probability of a specific compound event.
The main focus is on accurately identifying the region in the Venn Diagram that represents students playing the guitar and the drums but not singing in the choir, and then computing the probability based on the number of elements in that region and the total number of students.
Key Concept Explanation
The probability of an event is determined by dividing the number of favorable outcomes by the total number of outcomes.
In the context of this Venn Diagram, the favorable outcomes are the students in the “G and D only” region, and the total number of outcomes is found by summing up the values in all regions of the Venn Diagram.
Step - by - Step Solution
Identify the number of favorable outcomes: The “G and D only” region has 8 students, which represents the students who play the guitar and the drums but do not sing in the choir.
Calculate the total number of students: Add up all the numbers in the Venn Diagram:
Want More Practice Questions?
Access thousands of practice questions with detailed explanations on Scholardog.