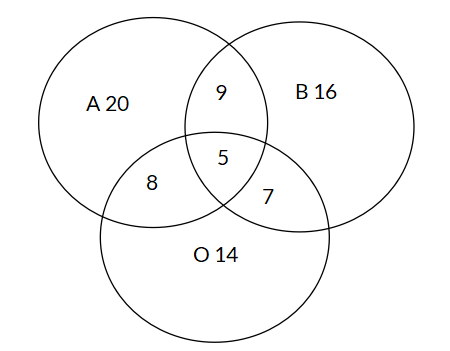
The Venn Diagram below shows the number of people who like different fruits: apples (A), bananas (B), and oranges (O). What is the probability that a randomly selected person likes exactly two types of fruits?
Options
A
B
C
D
Answer & Analysis
Answer
A
Analysis
Question Analysis
This question involves analyzing a Venn Diagram to determine the probability of a compound event where a person likes exactly two types of fruits.
The main focus is on correctly identifying and summing up the relevant regions in the Venn Diagram that represent people liking exactly two - fruit combinations, and then calculating the probability.
Key Concept Explanation
We need to sum up the regions that represent the intersections of pairs of sets without including the region where all three sets overlap.
These regions are “A and B only”, “A and O only”, and “B and O only”.
The probability is then the sum of the number of elements in these regions divided by the total number of people (the sum of all regions in the Venn Diagram).
Step - by - Step Solution
Calculate the number of favorable outcomes: The “A and B only” region has 9 people, the “A and O only” region has 8 people, and the “B and O only” region has 7 people.
So the number of favorable outcomes is .
Calculate the total number of people: Add up all the numbers in the Venn Diagram:
Want More Practice Questions?
Access thousands of practice questions with detailed explanations on Scholardog.