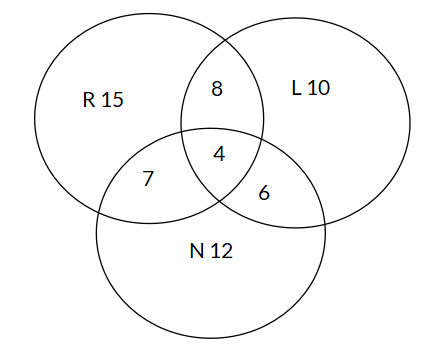
The Venn Diagram below shows the number of cars in a parking lot that have different features: sunroof (R), leather seats (L), and navigation system (N). What is the probability that a randomly chosen car has either a sunroof or a navigation system but not leather seats?
Options
A
B
C
D
Answer & Analysis
Answer
C
Analysis
Question Analysis
This question involves analyzing a Venn Diagram to calculate the probability of a compound event with specific conditions.
The main focus is on correctly identifying and summing up the relevant regions in the Venn Diagram that represent cars having either a sunroof or a navigation system but not leather seats, and then determining the probability.
Key Concept Explanation
We need to sum up the regions that meet the criteria: the “only R” region, the “only N” region, and the “R and N only” region.
These regions together represent the favorable outcomes.
The probability is calculated by dividing the sum of the number of elements in these regions by the total number of cars in the parking lot (the sum of all regions in the Venn Diagram).
Step - by - Step Solution
Calculate the number of favorable outcomes: The “only R” region has 15 cars, the “only N” region has 12 cars, and the “R and N only” region has 7 cars. So the number of favorable outcomes is .
Calculate the total number of cars: Add up all the numbers in the Venn Diagram:
Want More Practice Questions?
Access thousands of practice questions with detailed explanations on Scholardog.