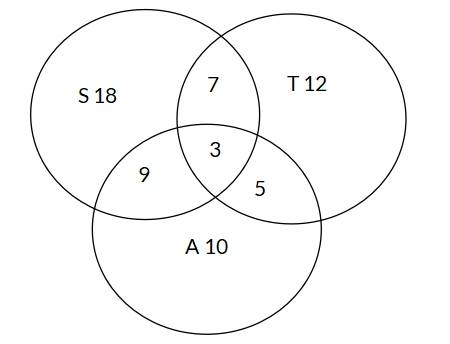
The Venn Diagram below shows the number of students who participate in different after - school activities: swimming (S), tennis (T), and art (A). What is the probability that a randomly selected student participates in swimming and art but not tennis?
Options
A
B
C
D
Answer & Analysis
Answer
B
Analysis
Question Analysis
This question involves analyzing a Venn Diagram to determine the probability of a specific compound event.
The main focus is on correctly identifying the relevant region in the Venn Diagram that represents students participating in swimming and art but not tennis, and then calculating the probability based on the number of elements in that region and the total number of students.
Key Concept Explanation
The probability of an event is calculated as the number of favorable outcomes divided by the total number of outcomes.
In the context of a Venn Diagram, we need to identify the region that meets the given conditions (swimming and art but not tennis) as the favorable outcomes, and sum up all the numbers in the Venn Diagram to get the total number of outcomes.
Step - by - Step Solution
Identify the number of favorable outcomes: The region representing students participating in swimming and art but not tennis is the “S and A only” region, which has 9 students.
Calculate the total number of students: Add up all the numbers in the Venn Diagram:
Click "Show Answer" to reveal the answer and analysis
Want More Practice Questions?
Access thousands of practice questions with detailed explanations on Scholardog.