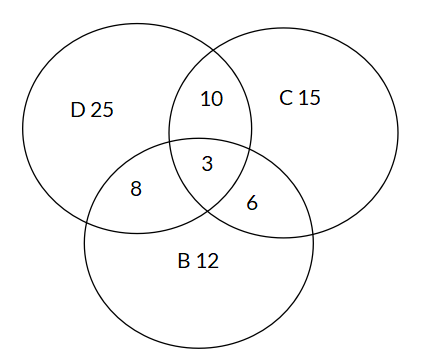
The Venn Diagram shows the number of people who own different types of pets: dogs (D), cats (C), and birds (B). What is the probability that a randomly selected person owns exactly one type of pet?
Options
A
B
C
D
Answer & Analysis
Answer
C
Analysis
Question Analysis
This question requires analyzing a Venn Diagram to calculate the probability of a specific compound event where a person owns exactly one type of pet.
The main focus is on correctly identifying and summing up the relevant non - overlapping regions in the Venn Diagram and then calculating the probability.
Key Concept Explanation
We need to sum up the regions that represent people who own only dogs, only cats, and only birds.
These are the non - overlapping parts of each set that meet the criteria of owning exactly one type of pet.
The probability is then this sum divided by the total number of people (the sum of all regions in the Venn Diagram).
Step - by - Step Solution
Calculate the number of people who own exactly one type of pet. The regions are only D (25 people), only C (15 people), and only B (12 people).
So the number of favorable outcomes is .
Calculate the total number of people. Add up all the numbers in the Venn Diagram:
Want More Practice Questions?
Access thousands of practice questions with detailed explanations on Scholardog.