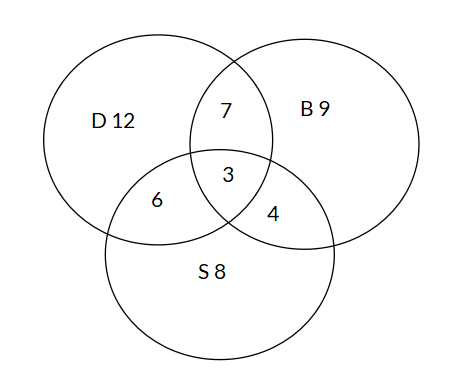
The Venn Diagram below shows the number of students who are members of different school clubs: drama club (D), debate club (B), and science club (S). What is the probability that a randomly selected student is a member of the drama club or the science club but not the debate club?
Options
A
B
C
D
Answer & Analysis
Answer
D
Analysis
Question Analysis
This question involves analyzing a Venn Diagram to determine the probability of a specific compound event.
The main focus is on precisely identifying the relevant regions in the Venn Diagram that meet the criteria of being in the drama club or the science club but not the debate club and then calculating the probability.
Key Concept Explanation
We need to sum up the regions that represent students in only the drama club, only the science club, and the intersection of the drama and science clubs (while excluding any regions that involve the debate club).
The probability is then this sum divided by the total number of students (the sum of all regions in the Venn Diagram).
Step - by - Step Solution
Calculate the number of students who are members of the drama club or the science club but not the debate club. The regions are only D (12 students), only S (8 students), and D and S only (6 students). So the number of favorable outcomes is .
Calculate the total number of students. Add up all the numbers in the Venn Diagram:
Want More Practice Questions?
Access thousands of practice questions with detailed explanations on Scholardog.