Question #6439629Single Choice
Geometry
Question
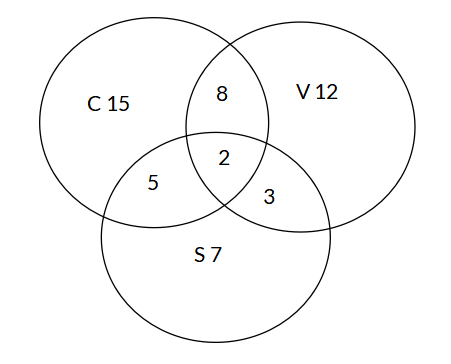
The Venn Diagram below shows the number of students who like ice cream flavors: chocolate (C), vanilla (V), and strawberry (S). What is the probability that a randomly selected student likes chocolate or vanilla but not strawberry?
Options
A
23/52
B
35/52
C
27/52
D
30/52
Answer & Analysis
Click "Show Answer" to reveal the answer and analysis
Want More Practice Questions?
Access thousands of practice questions with detailed explanations on Scholardog.
Practice Now - It's Free!