Question #6439074Single Choice
Geometry
Question
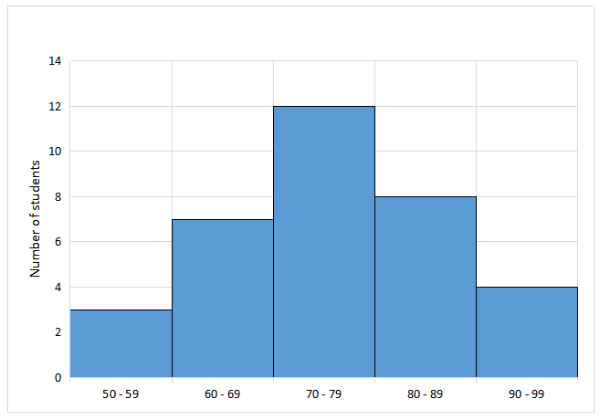
The histogram below shows the distribution of test scores (out of 100) for a class of students. Which interval contains the most concentrated scores?
Options
A
50–59
B
60–69
C
70–79
D
80–89
Answer & Analysis
Click "Show Answer" to reveal the answer and analysis
Want More Practice Questions?
Access thousands of practice questions with detailed explanations on Scholardog.
Practice Now - It's Free!