Recall the relationship between
velocity-time and position-time graphs:
The slope of a position-time graph gives
the velocity of the object. In a velocity-time graph, the area under the curve
gives the displacement of the object.
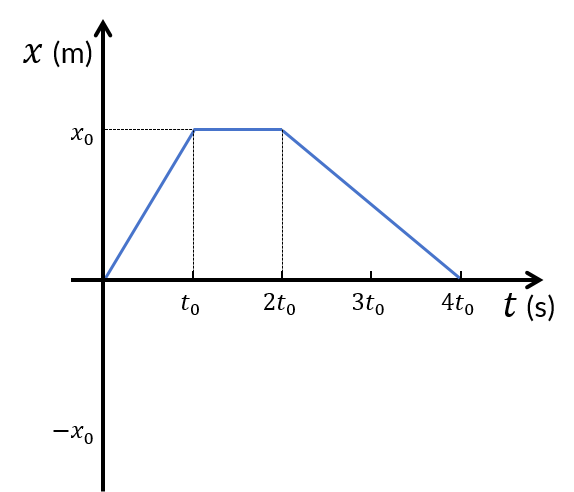
For the given velocity-time graph:
From t = 0 to , the velocity is a
positive constant . This means the object is moving with a constant positive
velocity, and the position-time graph should have a positive constant slope (a
straight line with a positive slope). The displacement in this interval is .
From to , the velocity
is 0. So, the object is at rest, and the position-time graph should be a
horizontal line during this time interval.
From to , the velocity
is a negative constant . This means the object is moving with a constant
negative velocity, and the position-time graph should have a negative constant
slope (a straight line with a negative slope). The displacement in this
interval is .
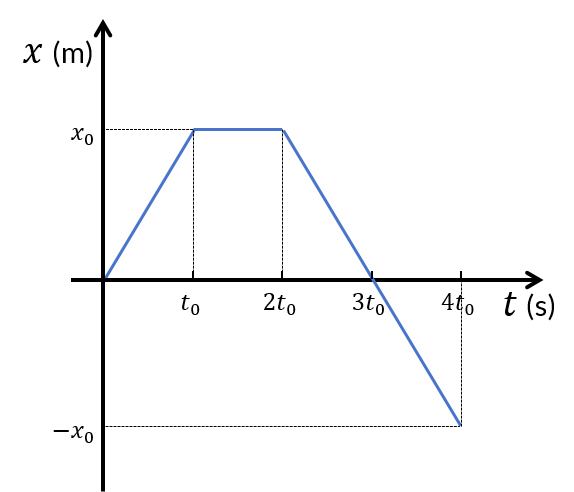
The total displacement is: . So, the position-time graph should end up at a
negative position.
Analyze each position-time graph:
Graph A
From