Recall the relationships between
position-time, velocity-time, and acceleration-time graphs and the direction of
motion:
In a position-time graph, the slope of the graph
gives the velocity and the sign of the slope (velocity) indicates the direction
of motion. A positive slope indicates motion in the positive direction, and a
negative slope indicates motion in the negative direction.
In a velocity-time graph, the sign of the
velocity indicates the direction of motion. If v>0, the object is moving in
the positive direction, and if v < 0, the object is moving in the negative
direction.
In an acceleration-time graph, acceleration
alone does not tell the direction of motion; it only tells whether velocity is
increasing or decreasing. To determine the actual direction, you must consider
the initial velocity.
Analyze each graph:
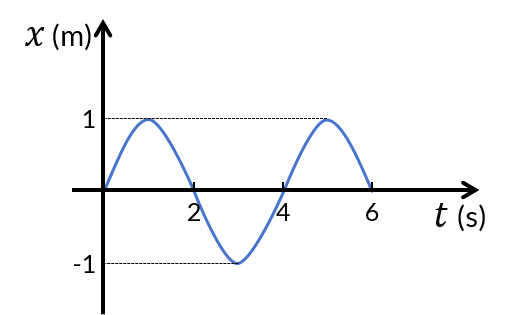
Graph A (position-time graph):
The slope of the graph (which is velocity)
changes sign multiple times. When the graph is increasing, the velocity is
positive, and when it is decreasing, the velocity is negative. So, the object
is not moving in a single direction.
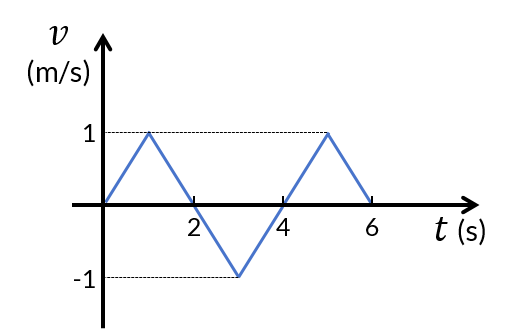
Graph B (velocity-time graph):
The velocity-time graph shows that the
velocity changes sign from positive to negative and then back to positive at
regular intervals. When v>0, the object moves in one direction, and when v
< 0, it moves in the opposite direction. So, the object is not moving in a
single direction.
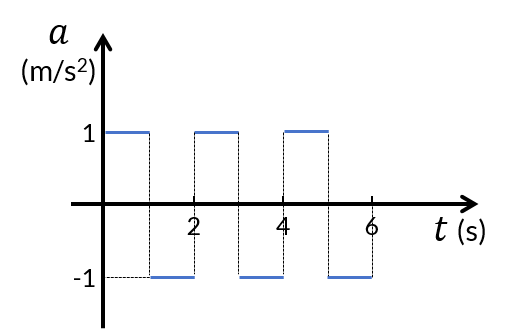
Graph C (acceleration-time graph):
The acceleration - time graph shows that
the acceleration is positive for the first part of the motion, which will cause
the velocity to increase in the positive direction.(When t=1s, ) Then, the acceleration becomes negative, but the object will
still be moving in the positive direction. The negative acceleration will just slow
it down to stop, (when t=2s,